
Introduction
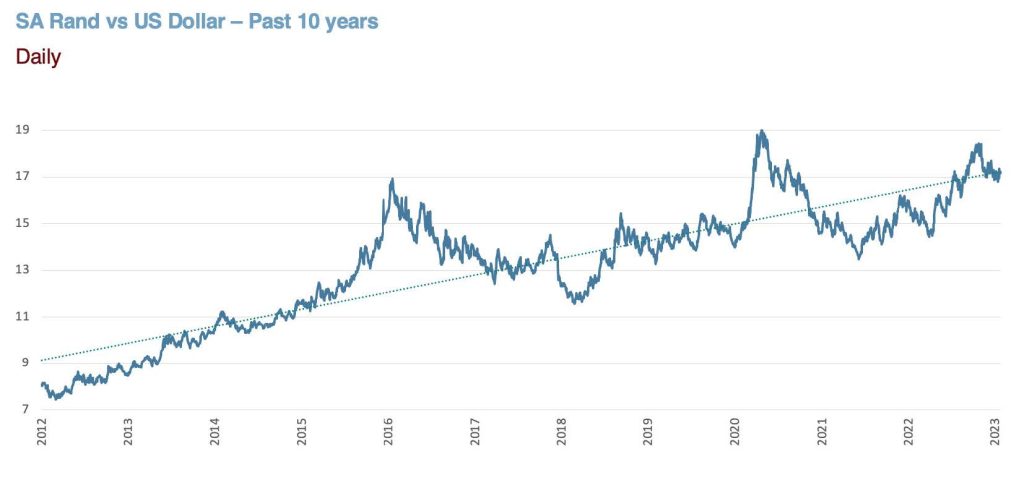
Over the past ten years to end 2022, the SA Rand has declined by a cumulative -50.1% against the US Dollar. Vice versa, the US Dollar has strengthened by a cumulative 104% against the Rand over the same period. On average, the Rand has depreciated by -5.9% a year. While it is important to be aware of short-term trends in the value of the Rand to try and maximise the value of each offshore transaction, it is also useful to be mindful of Rand’s long-term behaviour and the importance of systematically increasing offshore investment exposure.
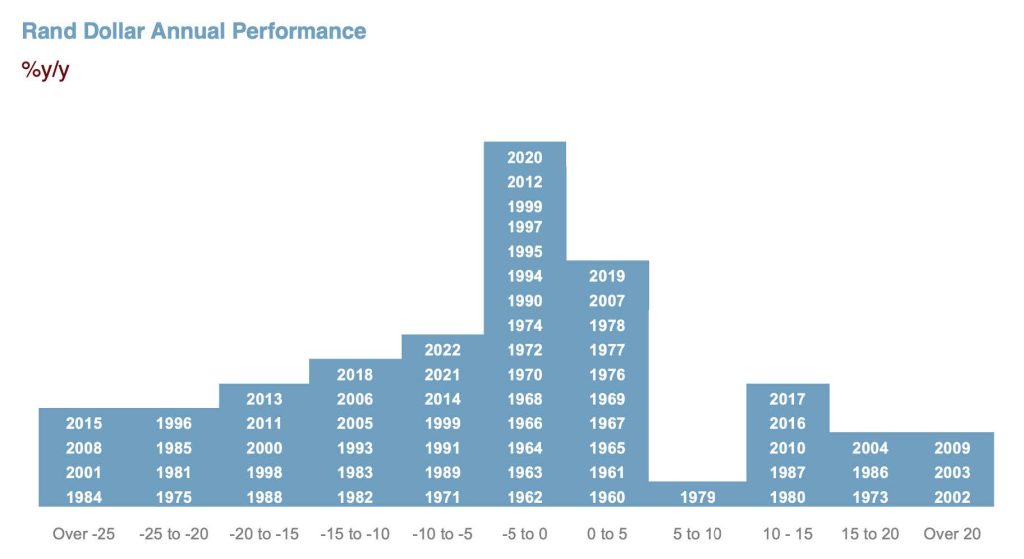
The average annual depreciation of Rand/Dollar exchange rate over the past 10 years has been -5.9%, which equates to a compound annual average decline of -6.7%. This does not mean that the Rand will depreciate every year, but it does demonstrate that the Rand has a strong weakening bias. In fact, the Rand depreciated in eight of the past ten years, while over the past 64 years, the Rand has weakened in 42 of the years. Importantly, during the past six decades the Rand has experienced bouts of significant strength, especially during 2022/2023. However, these periods of strength have typically followed periods of substantial weakness. The chart below reflects the number of years and extent of Rand/Dollar appreciation or depreciation for specific years. During most years the Rand oscillates between a gain of 5% and a loss of 10%, with the bias firmly to the downside.
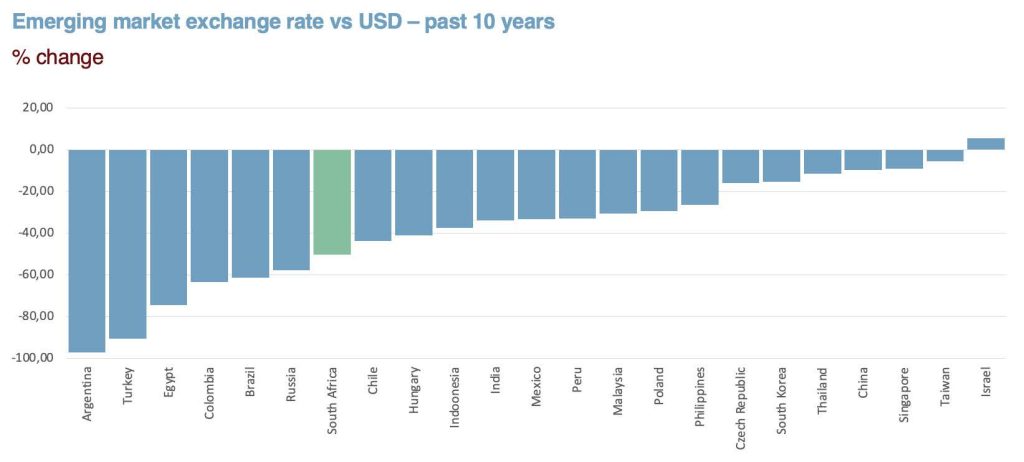
The Rand ranks as the 7th worst performing emerging market currency in the past 10 years. The worst is Argentina, followed by Turkey, Eqypt, Columbia, Brazil and now Russia (which is a recent addition to the long term category of weaker emerging market currencies). Each country has had its own unique set of circumstances that contributed to the extensive currency weakness.
In trying to estimate the likely value of the Rand over the next 10 years, we use the following
guidelines:
1. Economic Theory
The simplest economic model used to explain the movements of any exchange rate over time is purchasing power parity (PPP). In essence, the PPP model argues that the value of one currency will depreciate against another currency in line with the difference in inflation between the two countries. So, for example, over the past 10 years, SA consumer inflation averaged 5.1% per year while US consumer inflation averaged 2.5%, therefore the Rand should have depreciated by 2.6% against the Dollar per year to maintain the currency’s relative purchasing power. In theory, this would have ensured that R100 buys as much in South Africa as R100 worth of dollars buys in the US.
However, in reality, the Rand depreciated against the Dollar by an annual average of 5.9% – essentially twice as much as one should have expected in terms of relative purchasing power. This, together with similar calculations done for prior decades, highlights that the Rand tends to weaken by more than what theory or PPP suggests – more on this later in the discussion.
Therefore, we can assume a base rate of depreciation for the Rand/Dollar of at least the inflation differential between South Africa and the United States for the next ten years – assuming there are no structural changes to the South African Reserve Bank or US Federal Reserve’s interest rate policy and that the respective inflation targets remain unchanged. Correspondingly, we have assumed that SA’s inflation rate is likely to average 5% to 5.5% for the next 10 years, while the US inflation rate is projected in a range of 2% to 2.5%. This implies a minimum average annual depreciation of the Rand in the order of 3% to 3.5% for the next 10 years – purely based on inflation differentials.
2. The starting base for the calculation
When forecasting the Rand, it is important to adjust for the starting point from which these calculations are made, in other words, adjust for the fact that the Rand might already be under or over-valued. Currently, most Rand fair-value models (including from the South African Reserve Bank) reflect the fact that the rand is undervalued, but not significantly. The extent of the undervaluation varies depending on the specifics of the fair value model. The trade weighted Rand also provides a measure of fair value but against a basket of South Africa’s major trading partners. These models reflect that the Rand has very seldom been at fair value or stronger over the past years.
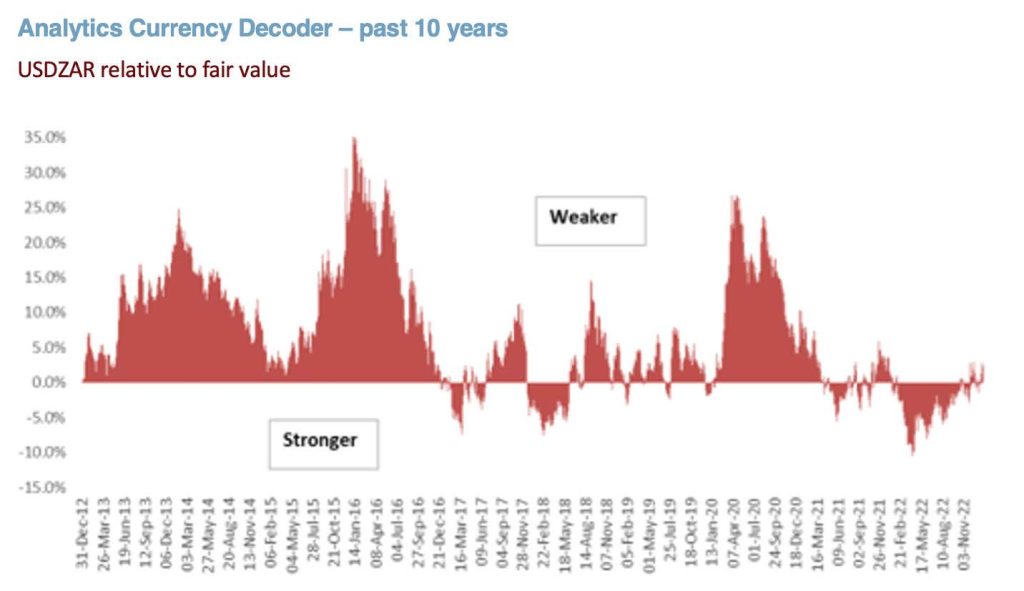
The Analytics Currency Decoder has the benefit of not needing a starting point as it is based on a mathematical self-learning algorithm to estimate fair value. It is therefore a useful validator of fundamental reasoning. The Analytics Currency Decoder also shows that over the past ten years, the Rand has traded weaker to fair value 75% of the time and is stronger than fair value 25% of the time. If you are using our Analytics Decoder for guidance on timing transactions, it holds that when the line is below the zero line, those levels should not be ignored for externalizing funds, with a long-term time horizon in mind.
3. Political risk premium
Rand fair value models, including those compiled by the South African Reserve Bank, show that over long time periods the Rand has a tendency to trade higher than fair value, implying that the Rand tends to be structurally weak. This structural weakness if often referred to a “political risk premium” or “policy uncertainty premium”, which represents the risk that SA’s Government policy initiatives mostly fail to deliver a sustained improvement in general economic conditions and that the risk to South Africa’s growth outlook has been largely to the downside.
The ongoing deterioration in South Africa’s overall economic performance results in the Rand maintaining a weakening bias that stretches beyond mere inflation differentials. In other words, market participants have factored in that the broader economic environment will weaken further due to sustained low growth, rising unemployment, deteriorating infrastructure, continued social tension and problematic government debt. Unfortunately, there is very little to suggest that this political risk premium will diminish.
Consequentially, we assume that the Rand will weaken by an additional 2% to 2.5% each year for the next ten years due to the persistent political/policy risk premium.
4. Other factors:
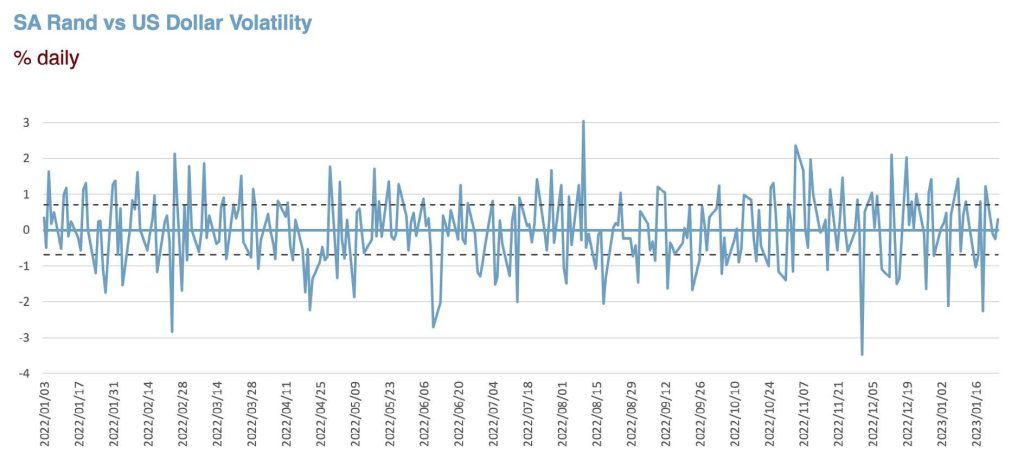
There is little doubt that over the next ten years the performance of the Rand will remain volatile, and at times highly volatile. This is partly because on a relative basis, the Rand is a highly traded and liquid currency, which means that pricing is readily available. Under normal circumstances this would be good news for Rand, however the accessibility of the Rand currency market tends to attract a disproportionally larger number of foreign currency speculators with deep pockets – which leads to bouts of significant currency volatility.
The Rand offers speculators a well-regulated market, with transparent pricing, conflict resolution mechanisms, favourable market hours and language, all providing a platform for trading confidence. Many analysts regard the Rand as a proxy for developments in emerging markets, which highlights that the Rand often weakens or strengthens due to factors that are largely unrelated to domestic economic conditions.
Fortunately, most Rand investors have learned to cope with the increased volatility, largely through the use of currency hedging, but it remains a key consideration when considering the timing and extent of offshore transactions.
Conclusion
Generally, most currency market participants have grown to accept that the rand has a tendency to weaken by more than inflation differentials. Forecasting the Rand in the short-term (3, 6 -12 months) entails taking into account how economic conditions may change, namely seasonal factors, some specific capital flow factors, global sentiment towards emerging markets, how risk parameters around the world are going to change and interest rate changes. Beyond 12-18 months, these factors play less of a role. This is when one must look at inflation differentials as a guide to currency direction, and in South Africa’s case, one would need to price in an additional risk premium.
Inflation differentials and the country’s risk premium suggest an annual average depreciation of 5-6% over the next ten years. Importantly the path between now and ten years-time will, no-doubt, be erratic. With a long term methodology in place here are the numbers for the end of 2032, from R17/USD at the end of 2022:
-5% R28.39/USD
-5.5% R29.90/USD
-6% R31.56/USD
While this seems extreme, it is important to remember that 10 years ago the Rand was trading at R8.48/USD, and yet it ended 2022 at R17/USD.
As an emerging market, South African businesses and households need to have access to international goods and services to remain competitive as well as retain their current standard of living. If the Rand is depreciating by more than the inflation differentials each year, which it has exhibited over the past three decades, our global purchasing power can only be protected by diversifying our assets and/or income offshore.
Written by: Alison Barker, Economist and Head of Analytics Consulting FX Solutions